

Imagine it’s the evening on May 16, 2025, and Bitcoin is lighting up the financial world at $103,239, a fiery 31.8% surge from its April 7 low of $78,324. We’re feeling that nostalgic West Coast vibe, like waiting for a Cartoon Network rerun while the $200k BTC loading screen hums in the background. The weekly chart is ablaze with higher lows and highs since mid-April, closing this week near $103,222, just a heartbeat from the December 2024 peak of $105,788. Ethereum (ETH) broke its March 24 highs of $2,102.08 on May 8, BLOK hit $41.96 back in February, and we’re in a full-on bull market. With the CBBI confidence score at 76.29%, Bitcoin’s flames are roaring, but where will they peak over the next seven months, and how high can they climb? Let’s spark some insights, with the hottest details waiting behind the veil.

A Bull Market That’s Heating Up
Bitcoin is on a tear and the weekly chart is a sight to behold. Since that April 7 dip, BTC has been climbing steadily, with weekly closes rising from $93,697 (week of April 19–25) to $103,222 this week, painting a picture of higher lows and highs. We’re knocking on the door of that $105,788 resistance, and a break here could set the stage for something big. The CBBI’s confidence score, up from 71.28% on May 1, signals a late-stage bull market with room to run before hitting overbought territory, like November 2013 when BTC topped out at $1,184 with a 98.30% score. We’re 13 months post-halving (April 2024, around $60,000), and history points to a 2–3x gain, aiming for $120,000 to $180,000 by year-end. I am seeing $111,000 as the next milestone and $133,000 as the recent top. Could Bitcoin’s flames reach even higher in the coming months? Let’s uncover the key price points and what’s fueling this rally.
Unveil Bitcoin’s Hottest Peaks
The Technical Glow: Chart Insights That Shine
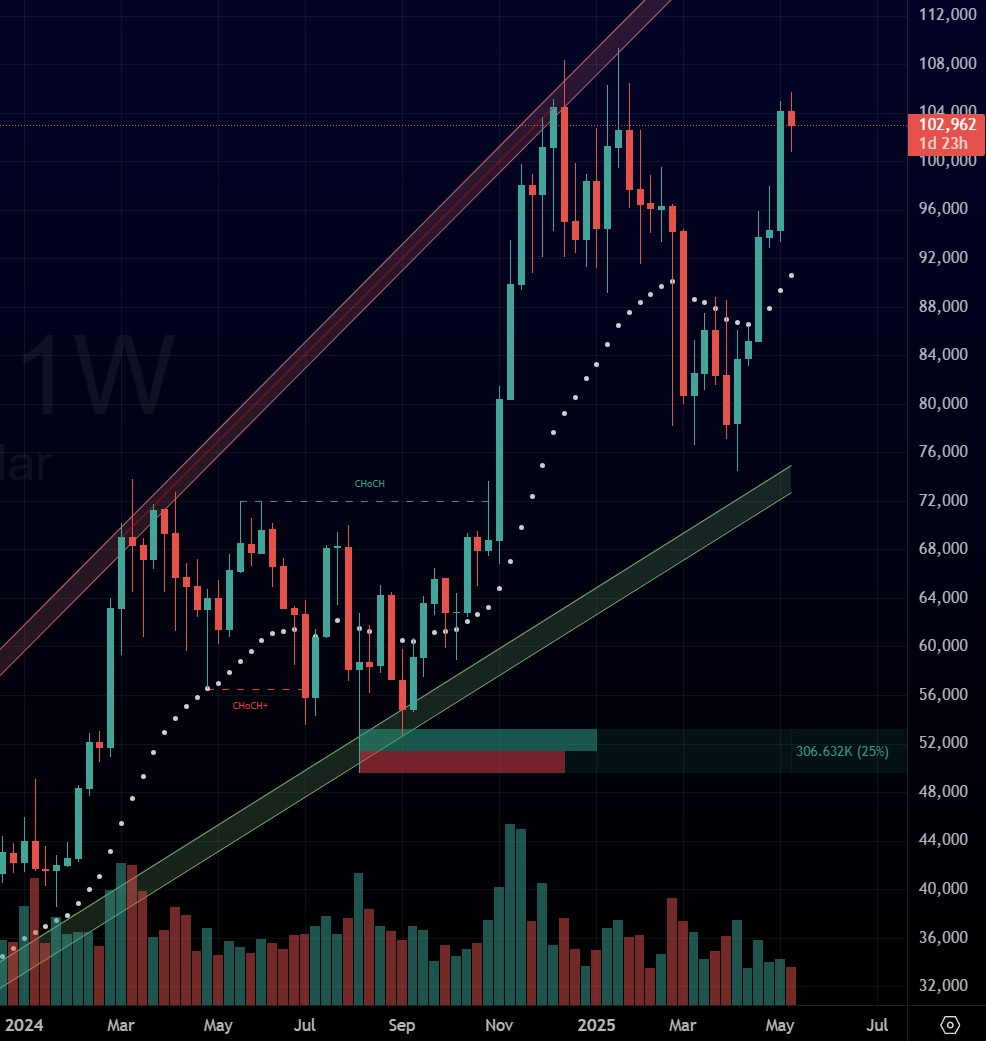
The weekly chart is glowing with promise, showing higher lows and highs since that April 7 low of $78,324. We’ve climbed from $93,697 (week of April 19–25) to $103,222 this week, poised to break that $105,788 December 2024 high. A move above that hits your $111,000 target, and it’s looking likely soon. The weekly MACD is likely flashing a bullish crossover, and the RSI, around 70, shows strength without overheating, giving us fuel for the next seven months. Post-halving cycles and market buzz, with some analysts calling for $135,000 to $200,000 by year-end, suggest Bitcoin’s ready to outshine the $133,000 ceiling with a fiery ascent.
Tether’s Fuel: Liquidity Keeps It Lit
Tether (USDT) is a key fuel keeping this blaze alive, commanding roughly 62% of the stablecoin market with a 24-hour trading volume of about $71 billion, according to recent data from CoinGecko. A declining USDT dominance, which dropped to 4.59% on May 13, often correlates with past Bitcoin rallies, like the 2021 run from $30,000 to $69,000, though direct causation remains debated among analysts. This inverted dominance ratio, where USDT’s share shrinks as investors rotate into riskier assets, signals potential upside for BTC. On-chain data points to whales accumulating USDT, tightening supply and adding liquidity to the market, though exact figures are unverified. While Tether’s dominance might face pressure from rising competition and could decline further by late 2025, its current liquidity supports market activity, facilitating gains in Solana (up 22%), Ethereum (44.3%), and Bitcoin (10% over a recent week), as capital flows into these assets.
Global M2: The Air This Fire Needs
Bitcoin’s flames thrive on global M2 money supply, with an 83% correlation from 2020 to 2024, according to Lyn Alden’s research. M2 appears to have bottomed earlier this year, with recent trends showing an uptick as of early May 2025, estimated at roughly 6% annualized growth, though exact figures and dates like a January 6 bottom remain uncertain due to data lags. This pattern echoes 2017, when BTC surged 360%, but that rally had unique drivers like ICO mania and limited institutional involvement, so history may rhyme rather than repeat. A typical 2–3 month lag between M2 inflection points and Bitcoin price action aligns with Bitcoin’s recovery since its April 7 dip, and the weekly chart’s steady rise since mid-April confirms this momentum. Macro winds are supportive: the DXY has shown a slight downward trend in Q2 2025, expected QT to be ended by QT by 2026, remain a consensus projection despite a potentially slower pace, and Trump’s public pro-crypto stance, including meetings with industry leaders, adds tailwinds, though rumored proposals like a Strategic Bitcoin Reserve remain speculative. ETF inflows, currently at $60–70 billion cumulative since launch, are providing oxygen, with bullish projections reaching $190 billion, a high bar, by year-end, though this figure assumes a significant risk-on shift.
High Price Points to Watch in the Next Six Months
Keep reading with a 7-day free trial
Subscribe to Flextiger’s Substack to keep reading this post and get 7 days of free access to the full post archives.