
Introducing Super Tiger mETF
One Month. +10%. The Market Lost Money. We Didn’t.

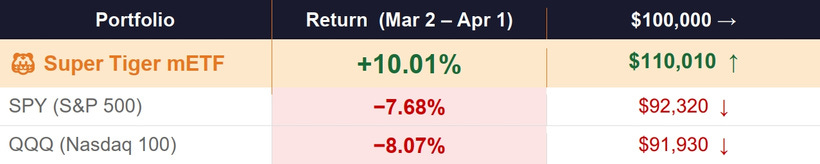
While the S&P 500 shed −7.7% and the Nasdaq fell −8.1%, the Super Tiger mETF delivered +10.01% — a gap of nearly 20 percentage points, built in one of the ugliest macro months in recent memory.
That single-month gap isn’t luck. It is a systematic methodology operating exactly as designed — across macro positioning, value detection, and a 15-signal technical scorecard that removes emotion from every trigger.
What Exactly Is the Super Tiger mETF?
If you’re new here, the question I hear most often is: “Where do I buy this on an exchange?” The honest answer: you can’t. And that’s a feature, not a bug.
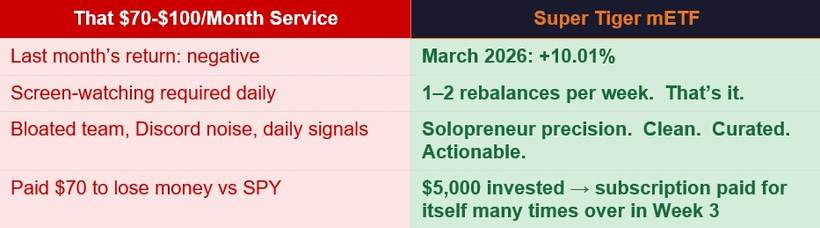
The m in mETF stands for mini or mock-up. The Super Tiger mETF is a curated portfolio of 10 to 20 carefully selected stocks and ETFs — each chosen through a structured three-step process, actively rebalanced once or twice per week, and published in full for Inner Circle members to replicate position by position.
Why a portfolio and not just individual stock tips? Because a portfolio behaves fundamentally differently from any single position inside it. Each holding may spike, dip, and consolidate during its run. But when 15 thoughtfully selected positions are moving through their cycles simultaneously, the peaks and troughs of individual names offset each other — producing a growth curve that is smoother, more consistent, and far less stressful to hold.
Diversified conviction. Not diluted returns.
The Evidence: What March Actually Delivered
Before we explain how the methodology works, let’s look at what it produced. Every position below was entered months before March — while most investors either hadn’t noticed the setup or were still waiting for “confirmation.”
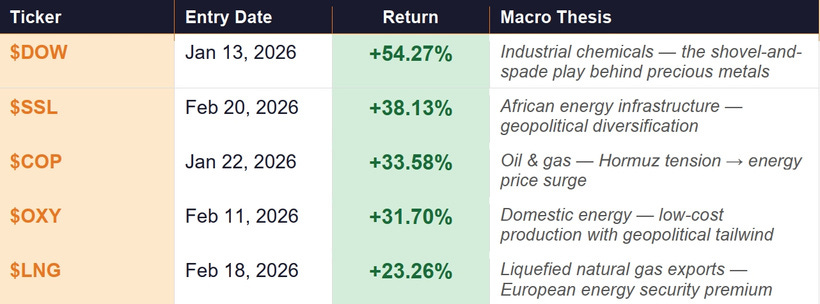
Each of these entries was made weeks before the mainstream narrative crystallized. That is not coincidence. It is the natural result of a methodology built to see what most investors cannot yet see.
The Three-Step Investment Framework
Every Super Tiger position must pass three successive gates. No exceptions. The framework is borrowed directly from Strategic Sourcing methodology: define criteria before you see the candidates, score objectively, let the data decide.
Step 1 — Read the Macro Map Before Everyone Else
Most investors react to events. We position ahead of them.
The deep machinery underneath the headlines — monetary policy, fiscal shifts, trade relationship changes, geopolitical disruptions — creates slow, powerful capital tides that shift from one sector to another over weeks and months. If you can read those tides while they are still building, you can be positioned before the crowd even senses the current.
Every sector cycles through the same stages: basing, advancing, topping, declining. Most investors only see the advance after it’s already on the news. My job is to identify the base while it’s still silent.
The food crisis trade that’s building right now follows the same chain: War → energy disruption → fertilizer supply shock → missed planting seasons → grain price surge → cascading food inflation. We’re already in position. The headlines haven’t broken yet.
Step 2 — The Value Valley: 18 Floors Underground
The single most expensive mistake retail investors make is what I call the Post-News Awakening: by the time a story hits your feed — an earnings beat, a geopolitical shock, a hot new sector — the market has already moved. The trade is crowded. The easy money is gone. Acting on visible news puts you last in line, buying into positions that smart money is quietly exiting.
My counter-strategy is the Value Valley. I don’t avoid hot sectors — I avoid the hot stocks within them. Instead, I ask: what got left behind?
I hunt for assets that have fallen 18 floors underground: beaten down 50–80% from their highs, bottoming out for at least three months, with no panic left, no trapped sellers, no remaining overhang — just a coiled spring sitting at the bottom with one direction remaining.
The bear market isn’t my enemy. It does my setup work for me. By the time I enter, the capitulation is complete. The last seller sold months ago. All that remains is the climb.
Step 3 — The 15-Signal Scorecard: Let Data Pull the Trigger
Once a candidate clears the macro and Value Valley gates, one final check stands between the idea and the capital deployment. I run the scorecard.
Over 15 years in Strategic Sourcing, I learned one discipline above all others: remove emotion from the decision. Build a scoring framework. Define criteria. Weight them. Let the data decide — not the story, not the excitement, not the urgency of a breaking news cycle. I apply exactly this discipline to every trade.
The Hidden Hand: Reading Smart Money Before the News Breaks
Of all the signals in the scorecard, the most powerful — and the most misunderstood by retail investors — is what professional traders call the Buying/Selling Momentum indicator. Understanding this principle is the key to understanding why the Super Tiger methodology consistently sees moves before they become obvious.
Why Price Lies — and What Tells the Truth
Price is the last thing to move. And price can be manipulated.
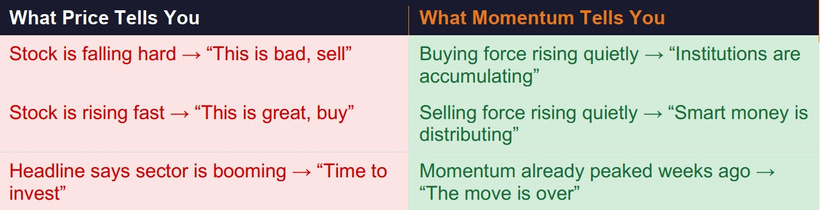
A stock price rising sharply can mean two completely opposite things: genuine accumulation by institutions building a long position, or distribution by large holders using the retail enthusiasm as exit liquidity. A stock price falling hard can equally mean panic capitulation — or institutional accumulation quietly buying into the selling pressure.
Price alone cannot tell you which is which. This is precisely how most retail investors lose money: they chase rising prices into distribution, and they panic-sell into accumulation.
Price can be staged. Orders cannot. Every real buy and every real sell must be placed in the order book. The buying and selling momentum tracks the true force of those orders — not what the price appears to be doing, but what the actual participants are actually doing.
The Third-Dimension Advantage
Most retail traders operate in two dimensions: price (is it going up or down?) and volume (is it trading a lot or a little?). The Buying/Selling Momentum indicator is a third dimension — it measures the balance of force between buyers and sellers in real time, using algorithms refined over decades.
What makes this powerful is its timing. Because institutional participants must place orders to accumulate positions — and because those orders flow through the market before the price fully reflects the intent — the momentum indicator registers the shift in force before the price move arrives. Informed money, whether acting on legitimate research or early intelligence, must place trades. Those trades cannot be hidden from the order flow. They show up.
This is the technical foundation of the Pre-News Awakening principle. By the time a trade is on the news, the informed money has already completed most of its accumulation. The momentum indicator catches that accumulation in real time — before the story breaks.
Signal Confluence: 15 Indicators, One Decision
No single indicator is sufficient. Each indicator has blind spots, false signals, and conditions where it fails. The power of the Super Tiger scorecard comes from convergence — requiring multiple independent systems to agree before a position is opened.
The 10+ indicators are organized across five functional dimensions:
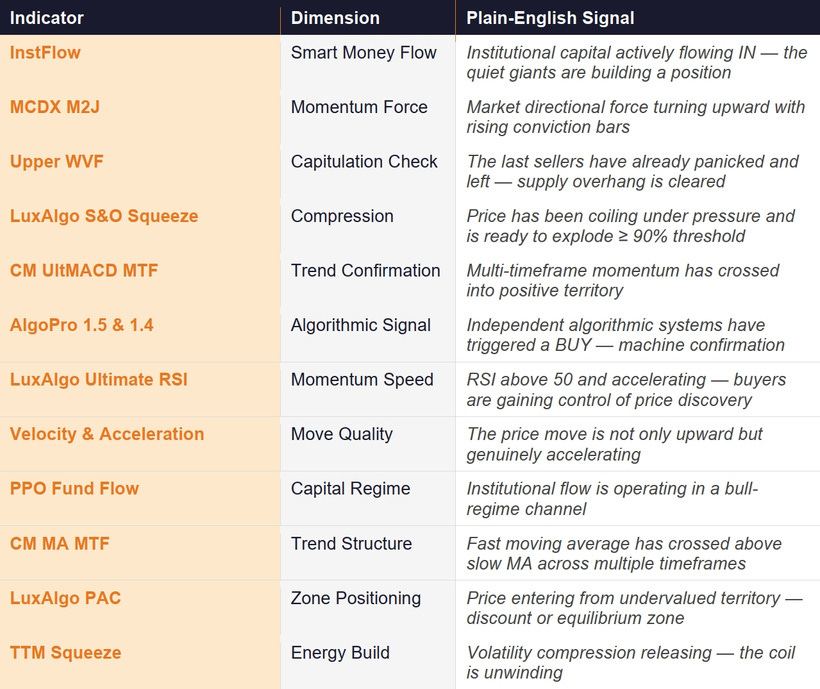
Entry is only triggered when a position reaches:
1. Path 1: 9 or more strong signals confirmed simultaneously, or
2. Path 2: 8 strong signals plus at least 4 supporting secondary signals.
This is not a system where one flashy signal overcomes a weak foundation. When 8 to 9 independent measurement systems point in the same direction simultaneously, the probability of a false signal drops dramatically. The scorecard does not remove uncertainty — it manages it systematically.
AI as Co-Pilot: Removing Emotion, Preserving Judgment
The Super Tiger mETF operates at the intersection of human insight and machine precision. I work closely with AI — specifically Claude, Anthropic’s frontier AI model — as a structured analytical co-pilot throughout the investment process.
What the AI Does
The AI contributes in three specific areas where systematic processing outperforms human cognition:
• Signal Verification — Every chart assessment is conducted by reading each of the 15 indicators against pre-defined, documented criteria. The AI applies those criteria exactly as defined — with no enthusiasm about a compelling story, no impatience with a slow setup, and no tendency to bend the rules because a thesis is exciting.
• Market Sentiment Synthesis — The AI processes macro news, geopolitical developments, fund flow data, and sector dynamics to identify the second- and third-order effects that most analysts miss. When a disruption occurs, the AI maps the full downstream chain: not just the direct impact but the cascade two and three steps removed, where the real trades live.
• Report Generation — Full trade analysis reports — like the one you’re reading now — are produced in both English and Simplified Chinese, covering fundamental context, macro thesis, signal scorecard, and trade parameters. This is the solopreneur’s force multiplier: the output of a research team, from one person plus one AI.
What the AI Does Not Do
The AI does not make investment decisions. It surfaces information, applies frameworks, and flags patterns. The final judgment — whether a setup is genuinely differentiated, whether the macro thesis still holds, whether the risk is acceptable — is always mine.
The goal is not automation. The goal is to eliminate the emotional variables that destroy returns: the FOMO that rushes an entry before the scorecard confirms, the fear that forces an exit before the thesis plays out, the narrative pull that convinces a trader to hold a losing position because the story is compelling. The AI keeps the framework in charge. The human provides judgment when the framework alone is insufficient.
An Example: Market Turning Points in Real Time
Here is what this collaboration looks like in practice. This month, the buying/selling momentum indicator for SPY went through one of its longest sustained declining periods since I began tracking it — a full month of softening buy force. Then, in late March, it began to turn.
Because the momentum indicator had begun reversing upward — before any positive price confirmation was visible — I held conviction in the long positions, and when the market opened sharply lower one Thursday morning, I had the confidence to exit the hedge positions within the first minute of trading. Not because of what the price was doing. Because of what the underlying force had already told me.
That is the AI-assisted framework operating as designed: objective signal reading, no hesitation, no second-guessing. The data had spoken. We acted.
What You’re Actually Getting
This is not a bloated service producing 40-page reports that change nothing about your returns. It is not a Discord server full of conflicting noise. It is not daily alerts that chain you to your phone.
It is a solopreneur running a focused, disciplined operation — lower overhead, sharper decisions, no incentive to pad content. What I invest in instead: premium AI services, professional-grade market data, and analytical methodology built to see around corners.
What We’re Watching Next: The Food Crisis Nobody Has Priced In
The same methodology that identified Oil & Gas in January, industrial chemicals in February, and a forgotten satellite company before the space sector ran is already pointing to the next major theme.
Modern agriculture runs on fertilizer, and fertilizer production is tied to natural gas and petrochemical inputs. As geopolitical disruptions drive energy prices higher and supply chains fracture, fertilizer is being squeezed at the source. When fertilizer becomes expensive or unavailable, farmers face a simple choice: plant less. Missed planting seasons cannot be recovered. That supply shock hits commodity prices with a lag of months — and that lag is our window.
We are already in position. $WEAT and $PDBA are now part of the Super Tiger mETF — entered before the mainstream food inflation narrative has arrived at your feed. When it does, we will already be holding.
War → Energy disruption → Fertilizer supply shock → Missed planting seasons → Grain price surge → Cascading food inflation. The chain is in motion. The window is now.
~~~~~~~~~~~~~~~~~~~~~~~~~~~~~~~~~~~~~~~~~~~~~~~~~~~~~~~~~
Fortune doesn’t announce itself — it settles quietly at your feet. The only question is whether you’re ready to reach for it.
Position early. Stay disciplined. Let the methodology work.
👉 Join the Inner Circle: patreon.com/c/Flextiger
DISCLAIMER
This newsletter is produced for educational and informational purposes only. It does not constitute financial advice. All investing involves risk. Past performance of any strategy or indicator does not guarantee future results. The Super Tiger mETF is a proprietary personal portfolio — not a registered fund. Always conduct your own due diligence and consult a qualified financial advisor before making investment decisions. Individual stock and portfolio returns cited are from personal trading accounts tracked via Composer.trade.